
Track every marker. Aim for optimal.
See exactly where each biomarker sits, where it's headed, and what to do next.
Import
AI lab extraction
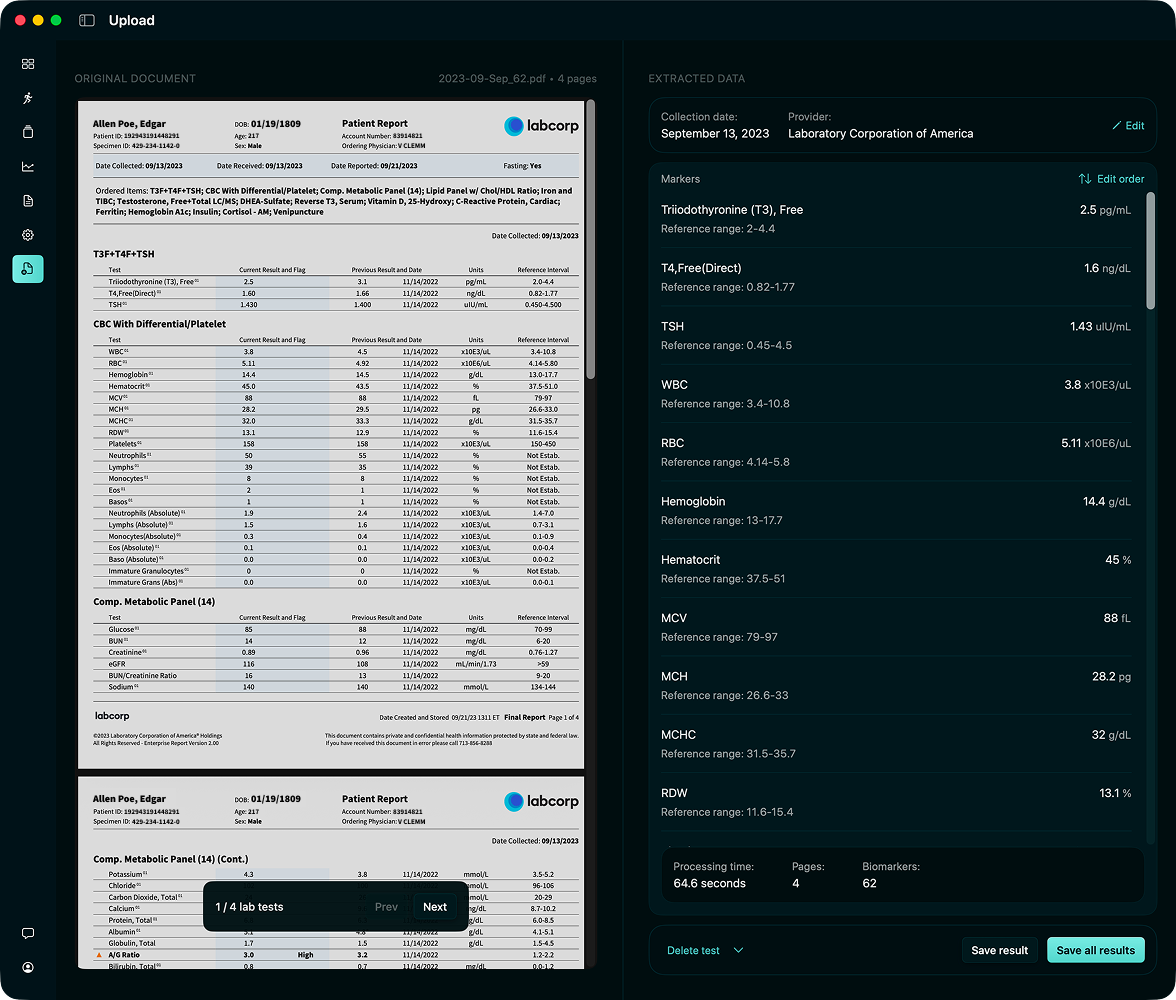
Hemo reads lab results from any source and turns them into standardized biomarkers you review before saving. Each measurement keeps its value, unit, and the lab's reference range.
- Bulk upload: drop your whole lab history at once
- Supported files: PDF, JPG, PNG, and encrypted PDFs
- Labs: Quest, LabCorp, MyChart/Epic, hospital PDFs, photos
- Smart matching: Hemo understands slight variations in lab names and units, and links each measurement to one biomarker in your library
Understand
A full readout in seconds
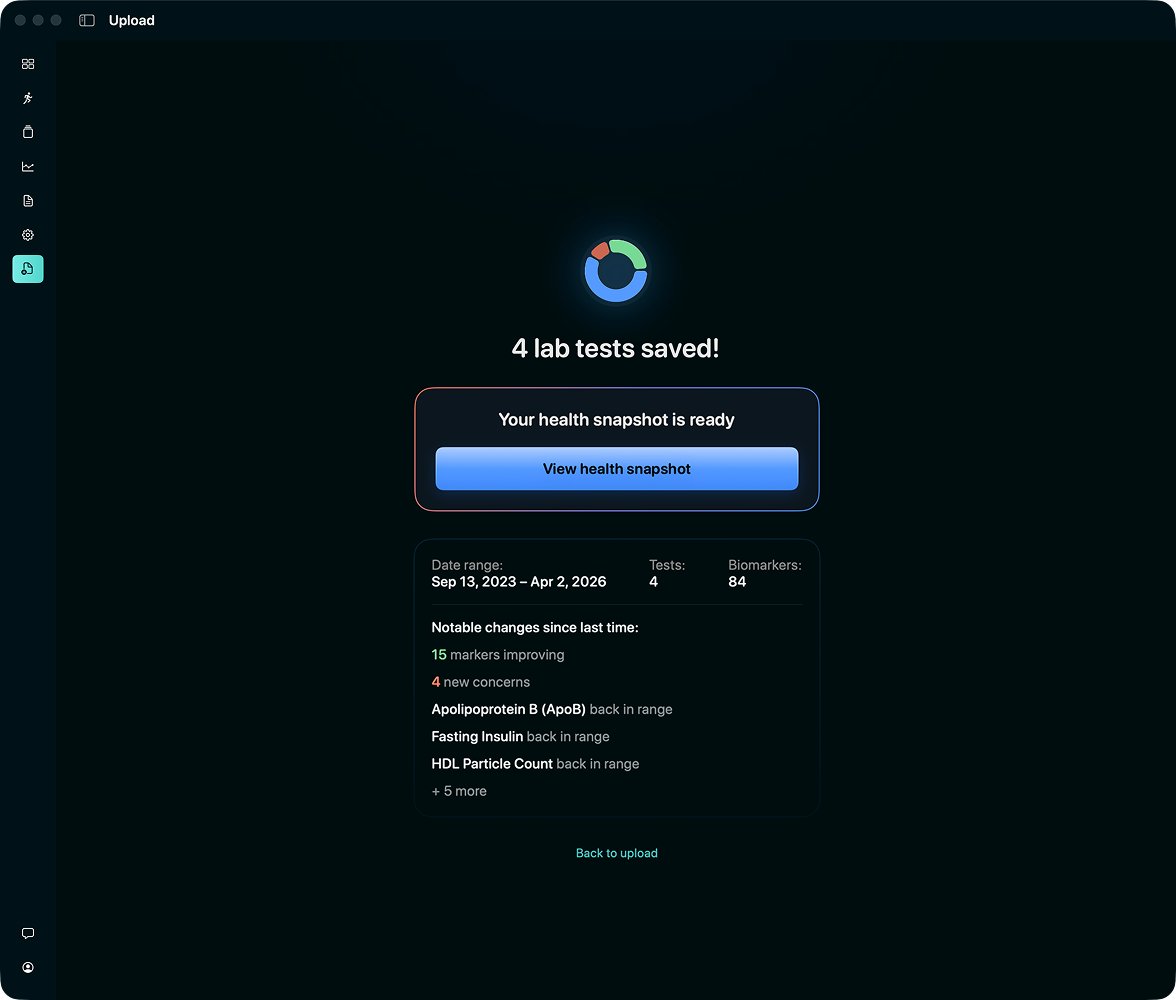
Upload a new test and Hemo doesn't just file it away. Within seconds your Health Snapshot and Action Plan update with the new numbers, and the test itself gets a read of its own: which markers to watch, and what changed since your last draw.
- Health Snapshot and Action Plan update automatically when you add a test
- Every test comes with its own priority markers and a note on what changed
- No waiting on a portal login or a callback to find out what your results mean
Browse
Every biomarker, one library
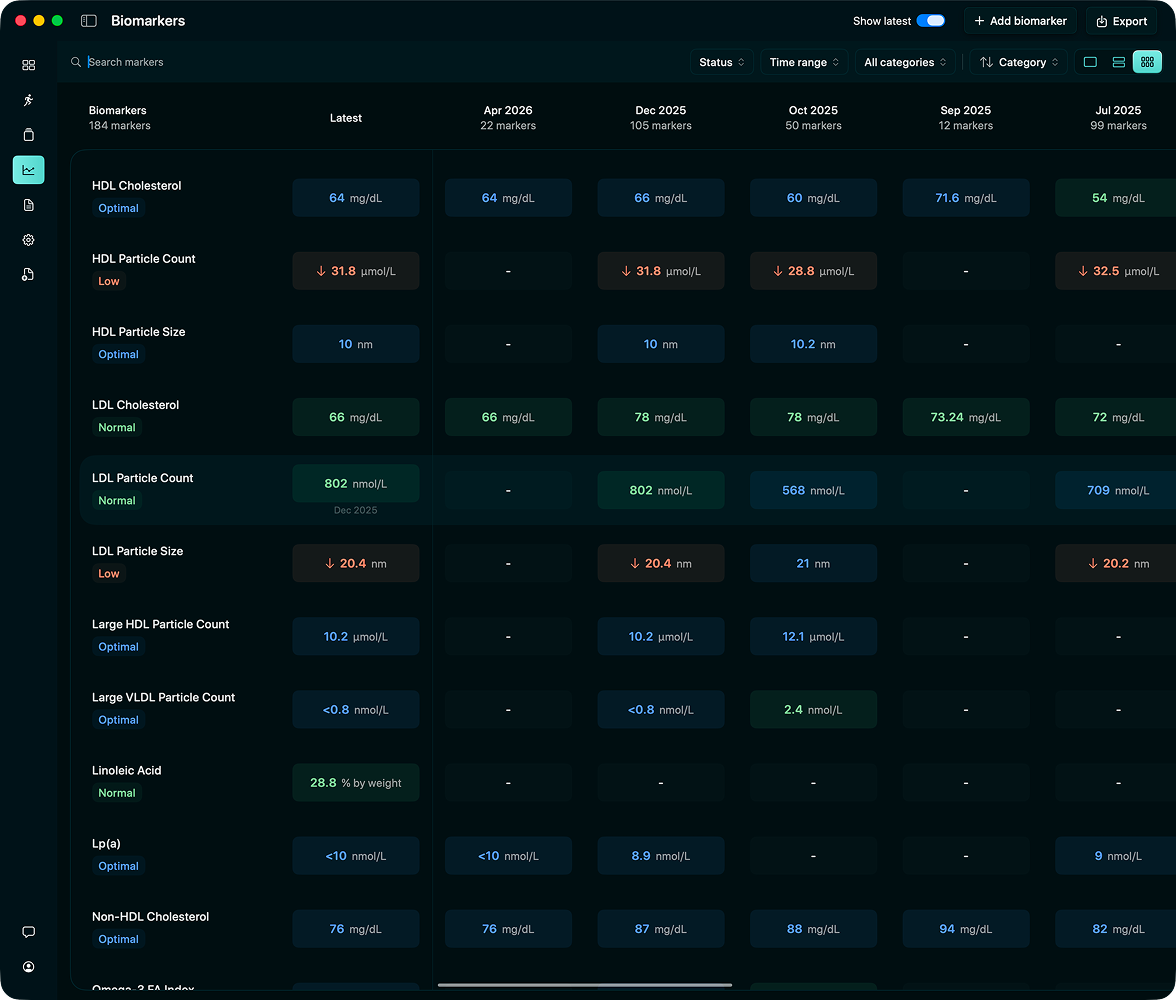
Every marker you track lives in one searchable library, and you choose how much detail you see. Start with a compact list, or switch to the expanded view for a full table of every marker and every measurement, color-coded by status, so your whole history is visible at a glance.
- Three view modes: compact, medium, and a full expanded history table
- Search that finds a marker even if your lab used a different name for it
- Filter and sort by time range, category, or status, and pin the markers you want to keep an eye on
Flagship
Optimal vs normal ranges
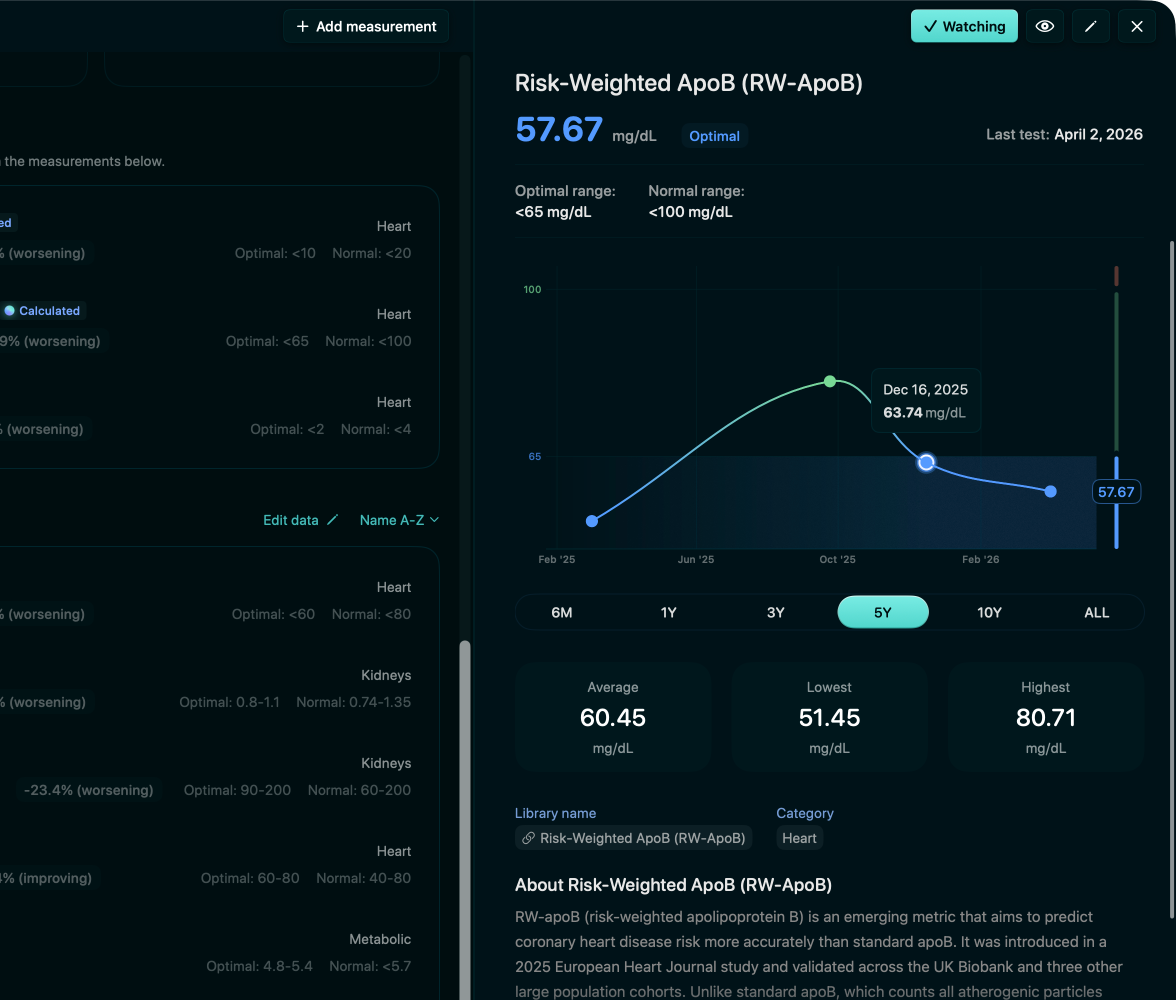
An optimal range is a tighter, functional target band that sits inside your lab's wider “normal” range. Hemo shows every marker's optimal range (in blue) alongside the normal range, and scores each value as Optimal, Normal, or Out of range — so you can aim for the target, not just avoid the flag.
- Three-tier status model
- Custom optimal ranges (yours or your doctor's)
- Sex/age-aware ranges where applicable
Understand
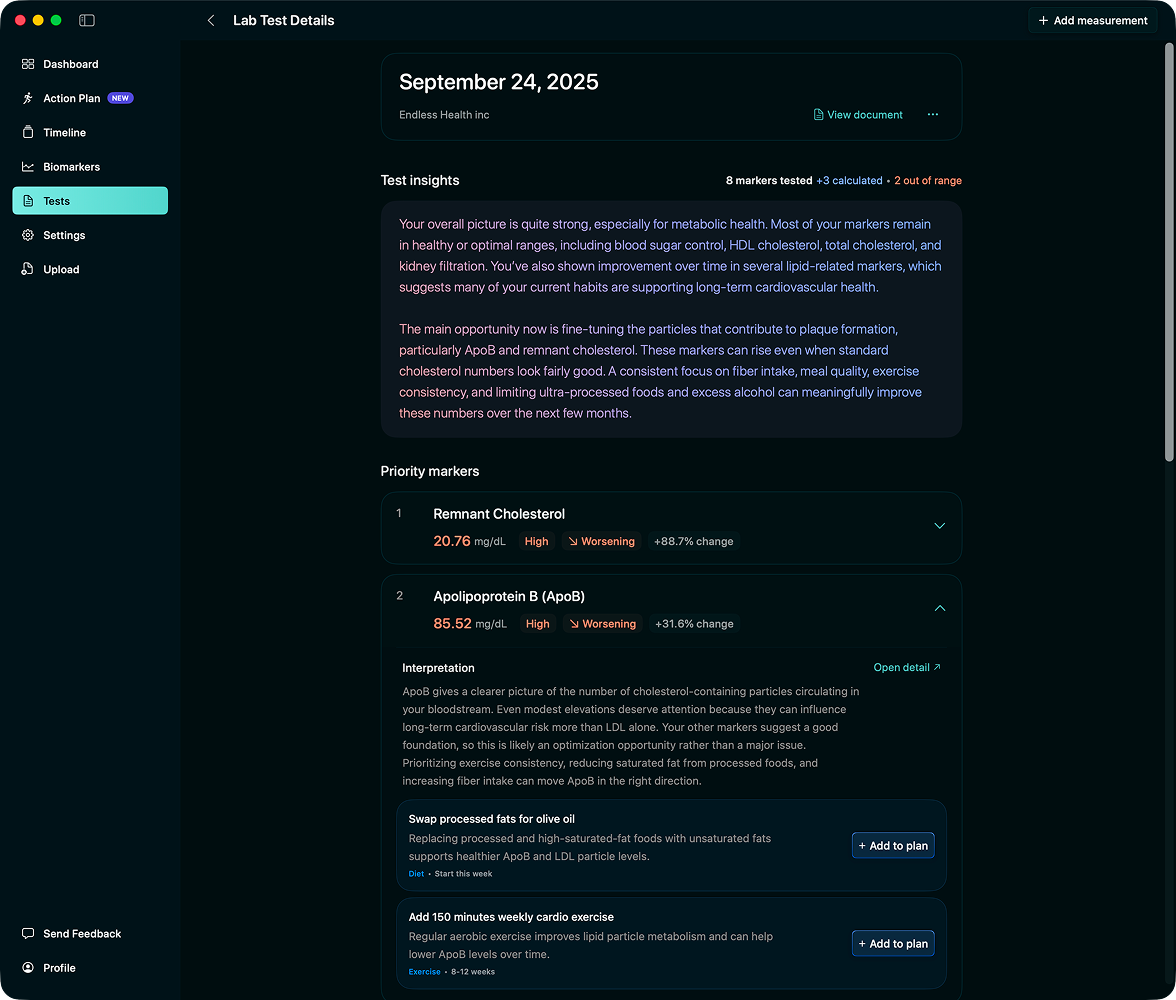
Every test gets its own explanation
Each lab is more than a list of numbers. Open any test and Hemo gives you a short explanation of that moment in time. You can see what changed since the previous test, and which markers are trending in the right direction.
- Priority markers, each with its own insight
- Calculated markers derived automatically from that test
Understand
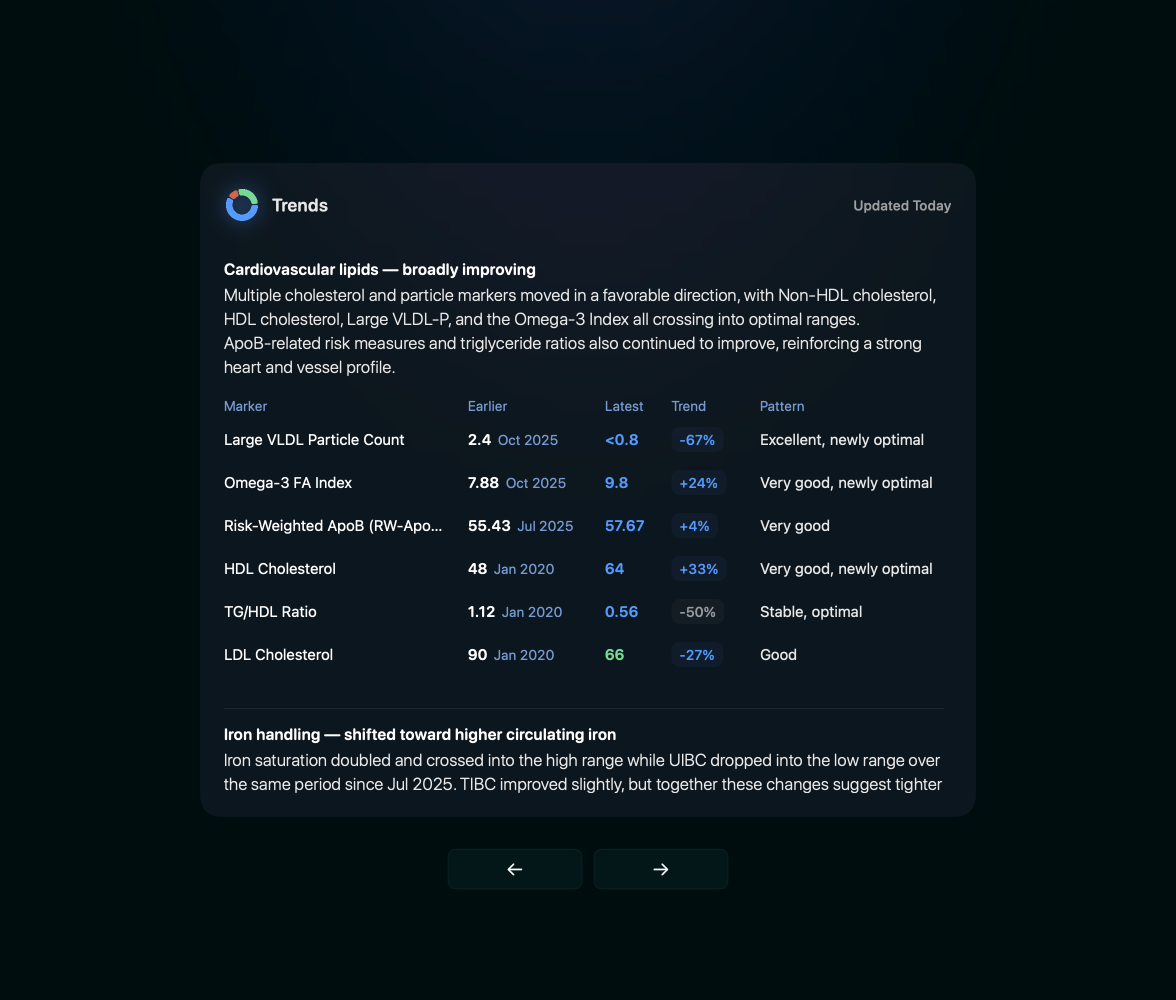
Your living health snapshot
Hemo wraps your latest labs into a short guided walkthrough. You get the big picture first, then the patterns across tests, then the few things worth focusing on next. Tap any marker if you want a deeper read.
- Five short slides, from overview down to what to focus on
- Expand any marker for a deeper interpretation
- Hands off to your Action Plan when you're ready to act
Hemo helps you organize and understand your lab results. It is not a medical provider and does not give medical advice.
Act
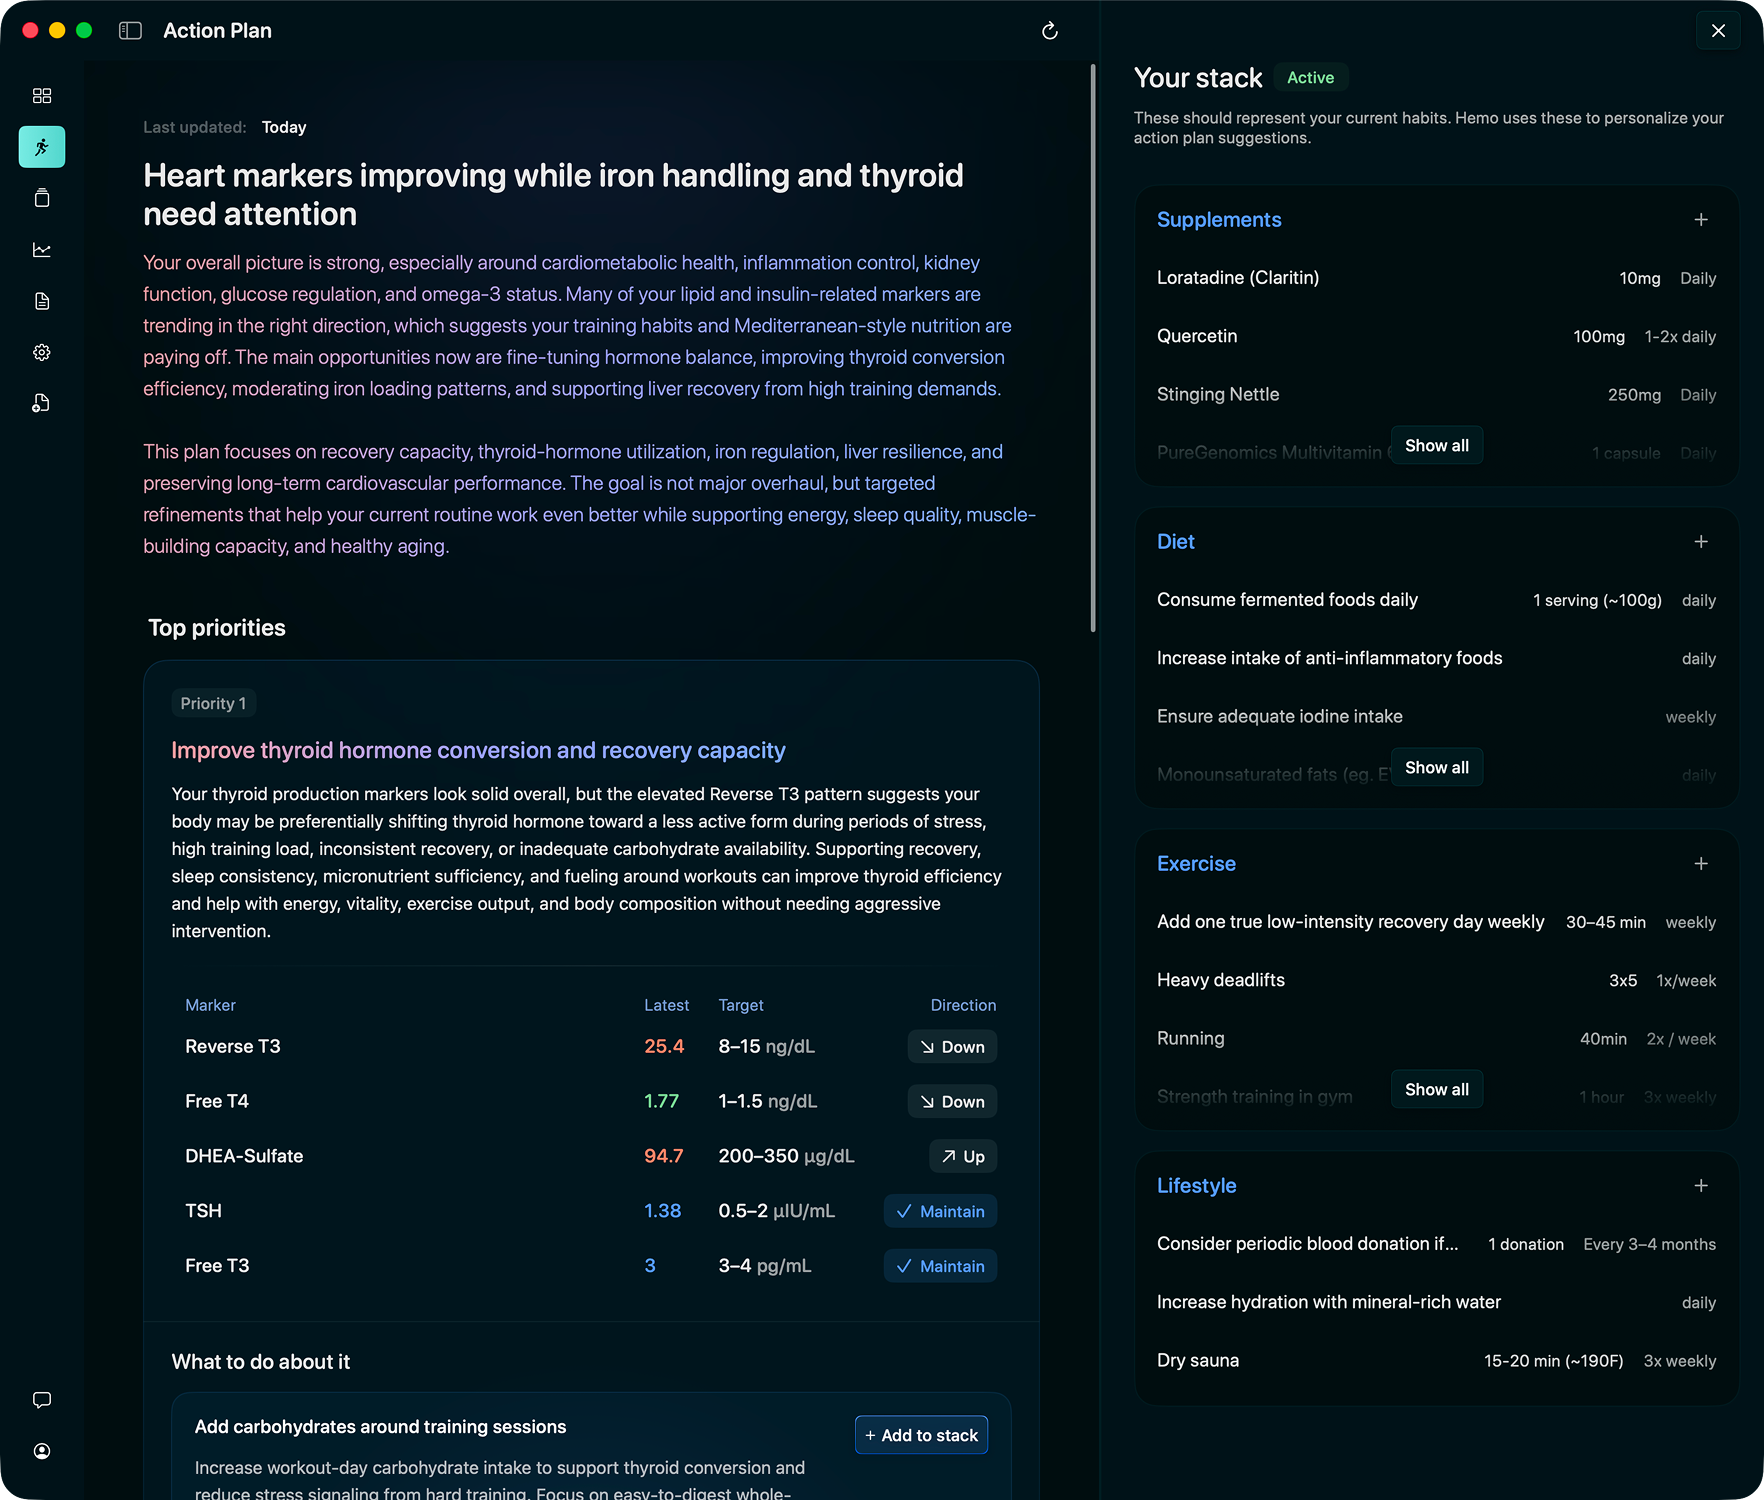
Action plan & your stack
Hemo turns your results into an Action Plan of prioritized strategies, each with target markers and concrete steps. Add any step to Your Stack to track it — supplements, diet, exercise, and lifestyle — and every change is logged to your timeline so you can see what moved your markers.
- Strategy themes with marker targets
- Commit a step, then edit dosage, frequency, and linked markers as you go
- Logged to your Timeline so you can see what moved
History
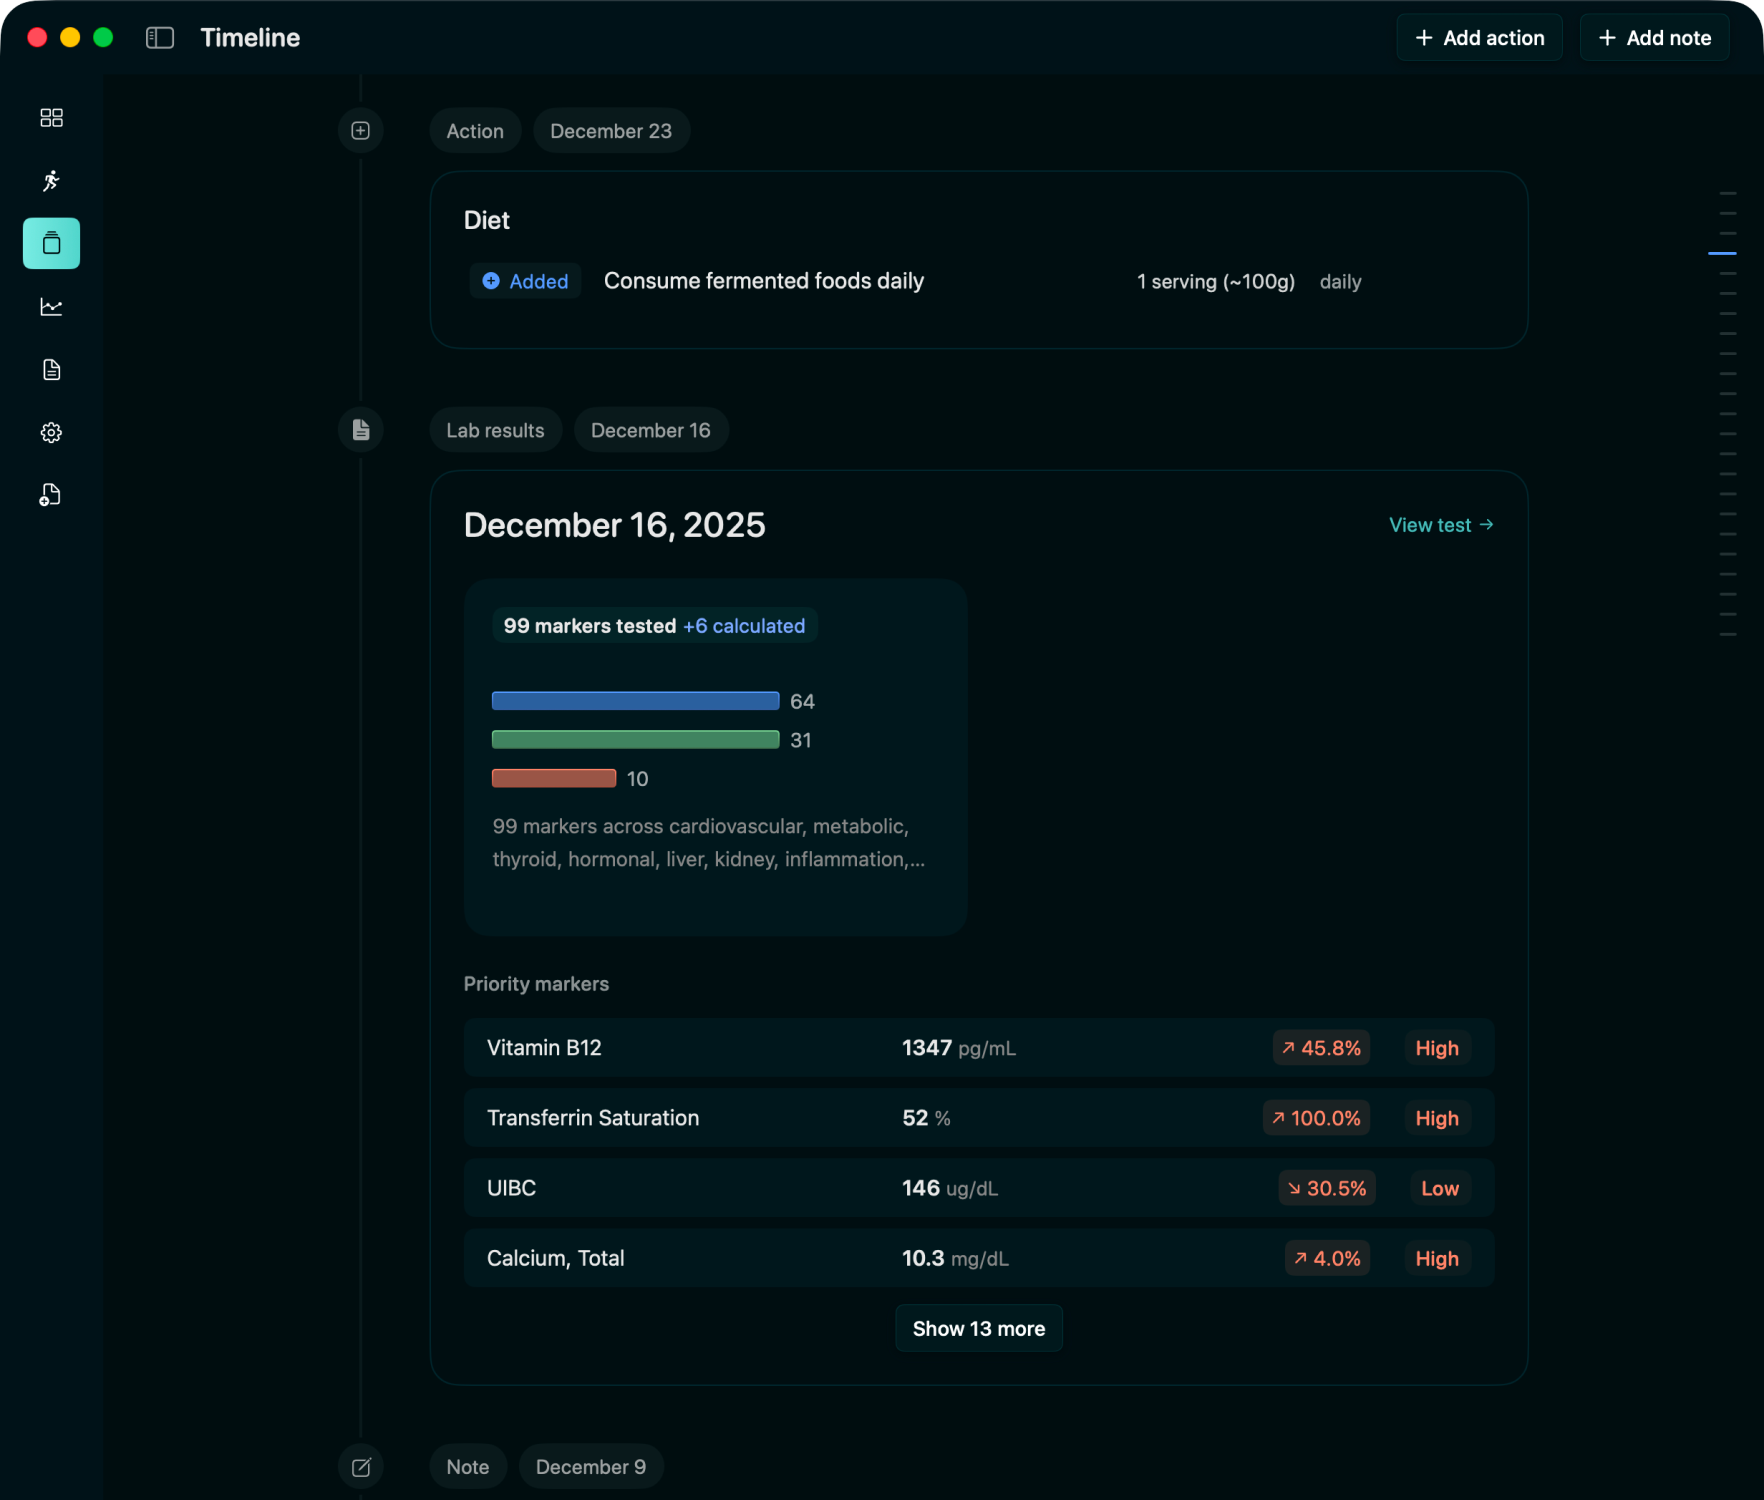
Your full history on one timeline
Timeline is the chronological feed of your labs: every test, note, and stack change on one spine, grouped by year. It’s where you see what happened between results — not just the numbers, but what you changed — so before and after is obvious.
- Test cards with a short summary and priority markers
- Notes and stack changes (supplements, diet, lifestyle) rolled up by day
- Add a note or a backdated stack action anytime
Extras
Also included
-
Review before save
Edit every extracted value before it lands in your history.
-
Custom optimal ranges
Set your own targets, or use the ones your doctor wants.
-
Sex- and age-aware
Ranges that account for who you are, not a one-size band.
-
SI unit toggle
Switch conventional and SI units with one control.
-
MyChart multi-date
Exports with multiple dates split into separate tests.
-
Scans and photos
Works with printouts and camera shots, not only clean PDFs.
-
Marker categories
Markers are grouped together automatically by body area. Reassign any biomarker’s category anytime.
-
Custom panels
Group the markers you want to see together.
-
Manual biomarkers
Add a marker yourself, and edit name, category, ranges, or values anytime.
-
Daily focus
A short welcoming summary each day on what to focus on.
-
Range toggle
Switch between your lab’s reference ranges and Hemo’s library ranges.
-
Backup and restore
Full local backup of your history, ready when you need it.
Import a lab.
See the rest unfold.
Join the waitlist and we'll email when your invite is ready.
Free during beta
One more step
Check your inbox
We sent a confirmation to .
Click “Confirm my spot” to join the list.
